Overview
Following the Early Access release of Prologue: Go Wayback!, we gained access to player analytics for the first time. While this outweighed the value of the approximate survival simulation, it did not solve the day-to-day balancing challenges.
Analytics could tell us what happened, but not what would happen if we changed a variable. We still needed a way to test hypotheses and tweak the core survival experience without relying on trial and error, waiting for a new build, and then waiting for players to play it in the evening.
The original simulation had served its purpose, but maintaining it no longer made sense. Instead, I decided to split it into a collection of specialized predictive balancing tools.
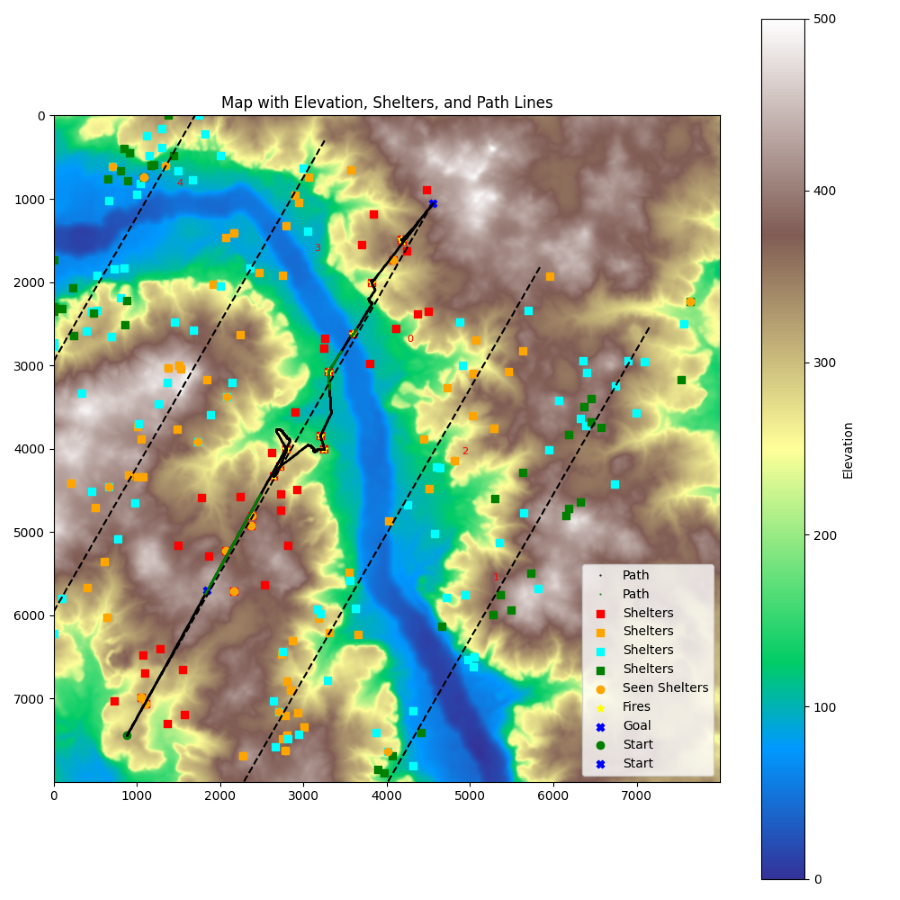
Screenshot of the last use of the simulation of Prologue.
The simulation exported a map to understand the relation between the exported data and the procedurally generated terrain.
The Simulation Was No Longer the Right Tool
The approximate simulation model for Prologue: Go Wayback!, which was originally created to balance the game before we had analytics, was the right tool during the months leading up to Early Access. At that stage, the major features were mostly locked. This made the simulation viable: the core systems were stable enough that I could model them, run scenarios, and trust that the results were representative of the game.
Once the game entered Early Access, the situation changed. We gained access to analytics, but the game also started evolving again. Systems were adjusted, features changed, and new balancing questions appeared.
The simulation had been designed to answer broad questions about survival. Maintaining a player simulation while the game was changing again became increasingly inefficient. Every gameplay change required updating the simulation, validating assumptions, and making sure the model still reflected the current version of the game.
At some point, the cost of maintaining the simulation started to outweigh the value it provided. It was time to retire the short-lived simulation and reuse its foundations in a more focused way.
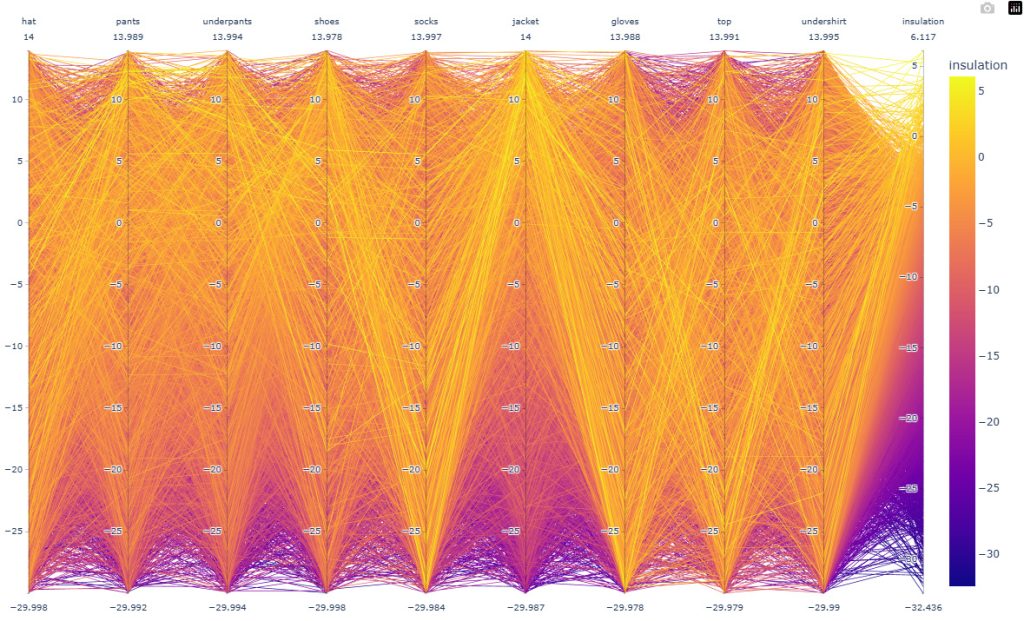
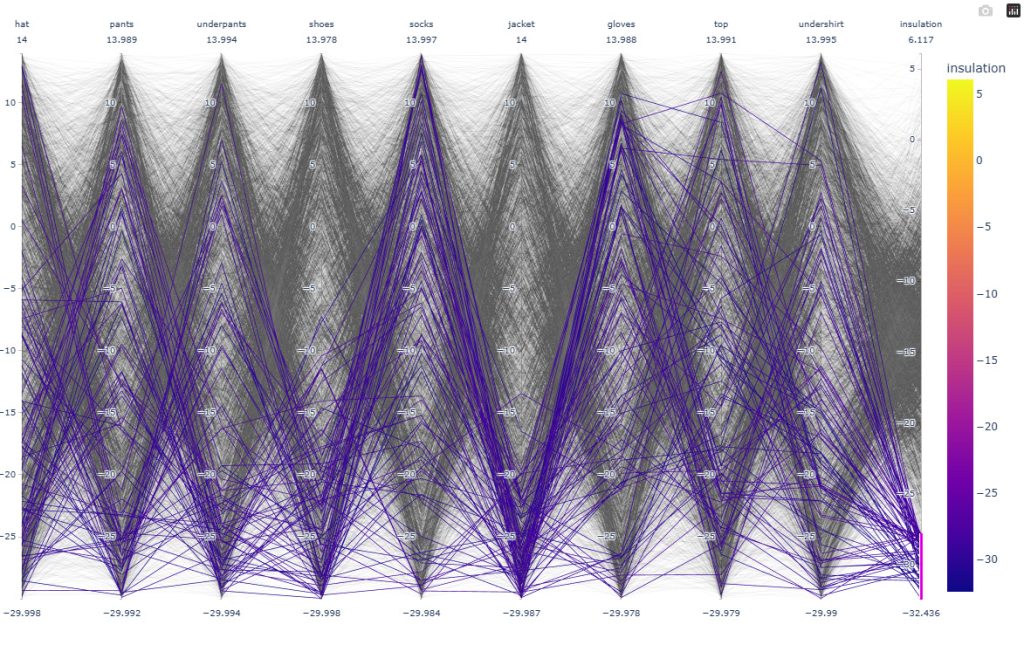
The tool generates n number of items (here 5000) with random insulation values. I then create a parallel coordinate plot based on the calculation of the insulation. This allowed us to catch a pattern difficult to understand from just playing or looking at the code: the weight of some items is impacting insulation so much that some other items become irrelevant. More information at the bottom of the post.
Identifying the Real Questions
While the simulation helped identify systemic issues, we still needed ways to analyze systems’ impact and validate hypotheses.
Take a question such as: How long can a player survive in a blizzard with the best equipment? At first glance, it seems straightforward. In reality, it is not. What does “best equipment” mean if the clothing is wet? Is the player inside a shelter? Outside? Protected from wind chill? Near a fire? Healthy or exhausted?
The deeper I looked into these questions, the more I realized that balancing required isolating variables rather than simulating everything at once. Instead of trying to answer every question with a single tool, I started building specialized tools focused on a specific set of systems. The goal was simple: define initial conditions and observe how the systems evolved.
Building Specialized Predictive Tools
The foundation for these tools already existed inside the simulation. The simulation itself was built from modular Python classes (per system), each responsible for a specific aspect of survival. This made extracting and recombining systems relatively straightforward. As a result, building a new tool was often quick, and each tool focused on a specific problem and produced a visual representation of the results.
Unlike the original simulation, there was no player behavior to maintain, no pathfinding to update, and no new gameplay mechanics to model. The tools relied mostly on core systems, which changed infrequently and were therefore inexpensive to maintain.
Examples include:
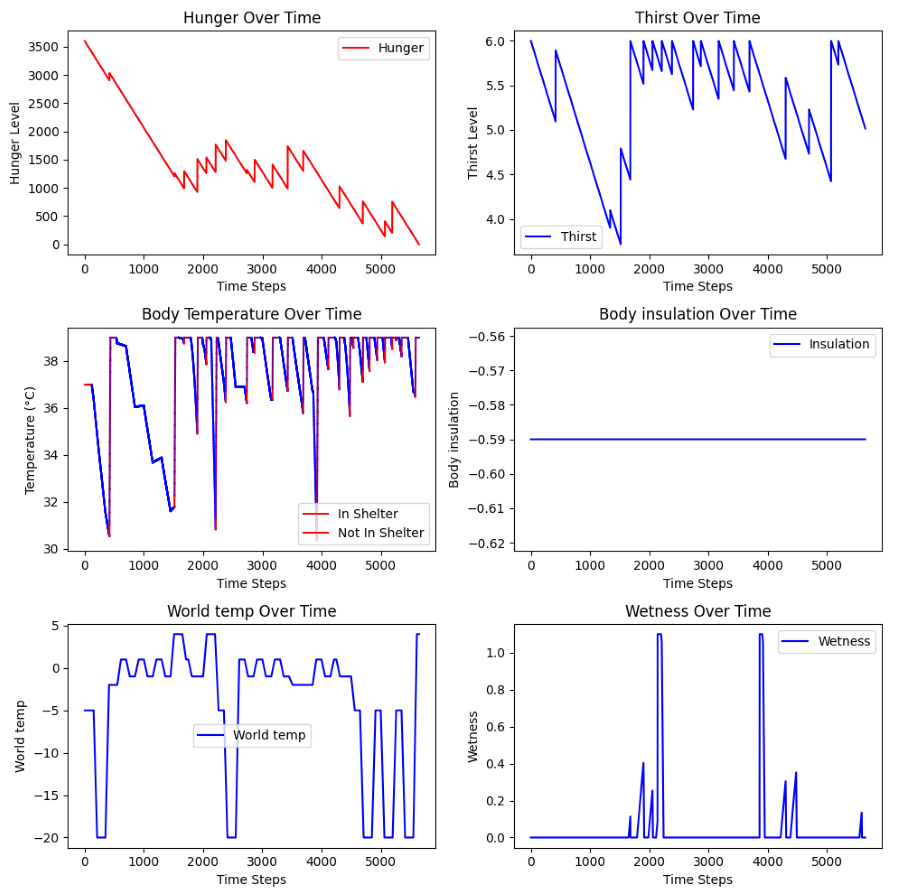
- Predicting body temperature over time under different weather conditions.
- Comparing the effectiveness of clothing combinations.
- Measuring the impact of wetness on insulation.
- Predicting survival windows during extreme weather events.
- Evaluating hunger and thirst progression under different scenarios.
Each tool allowed us to modify variables and immediately visualize the outcome, but also to quickly prototype new features like hypothermia by tweaking the calculation for the player’s character temperature.
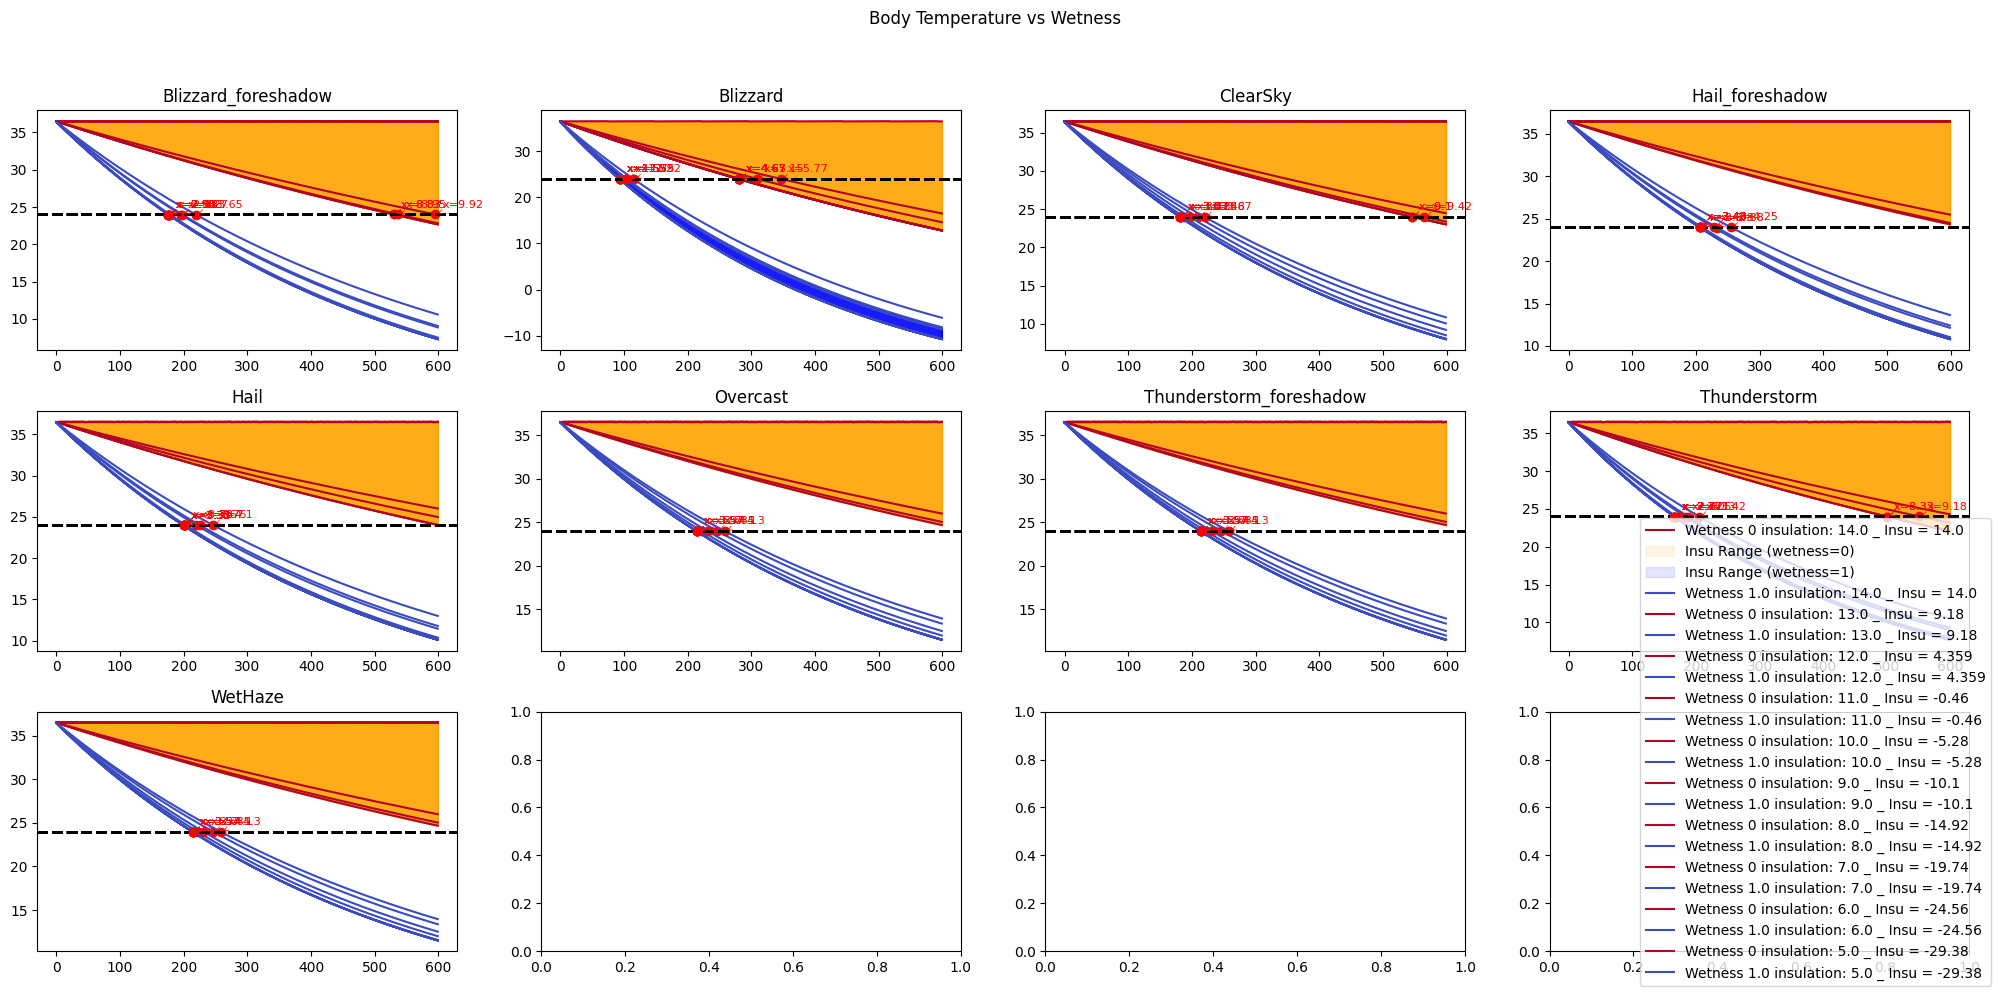
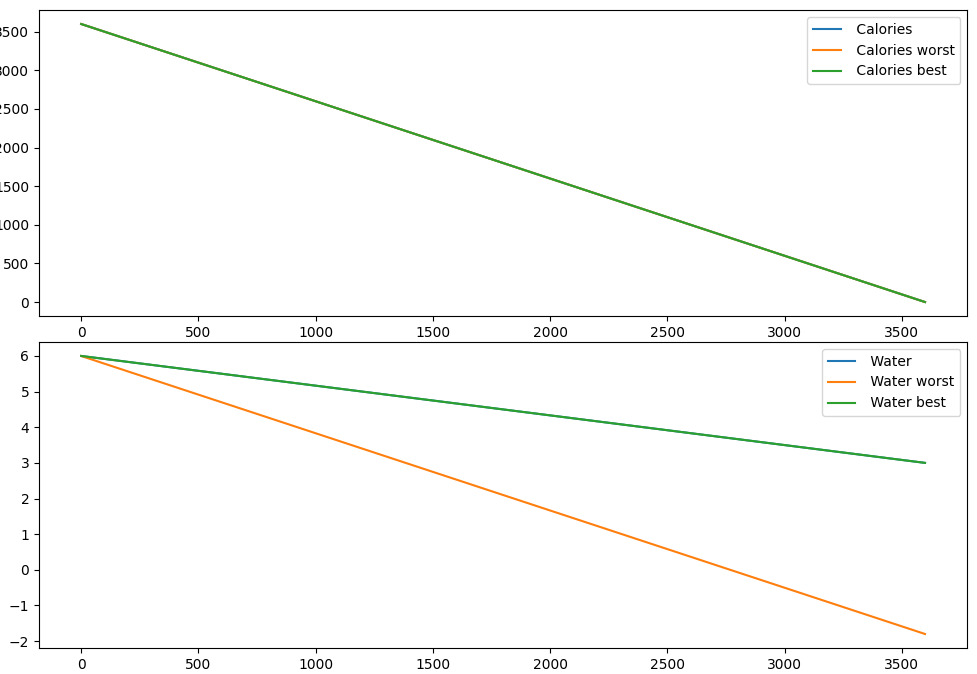
This tool allows us to clearly see that no matter your insulation, wetness is deadly, and how fast.
All values can be changed on top of being interactive, allowing us to investigate behavior in specific edge cases or ranges of values.
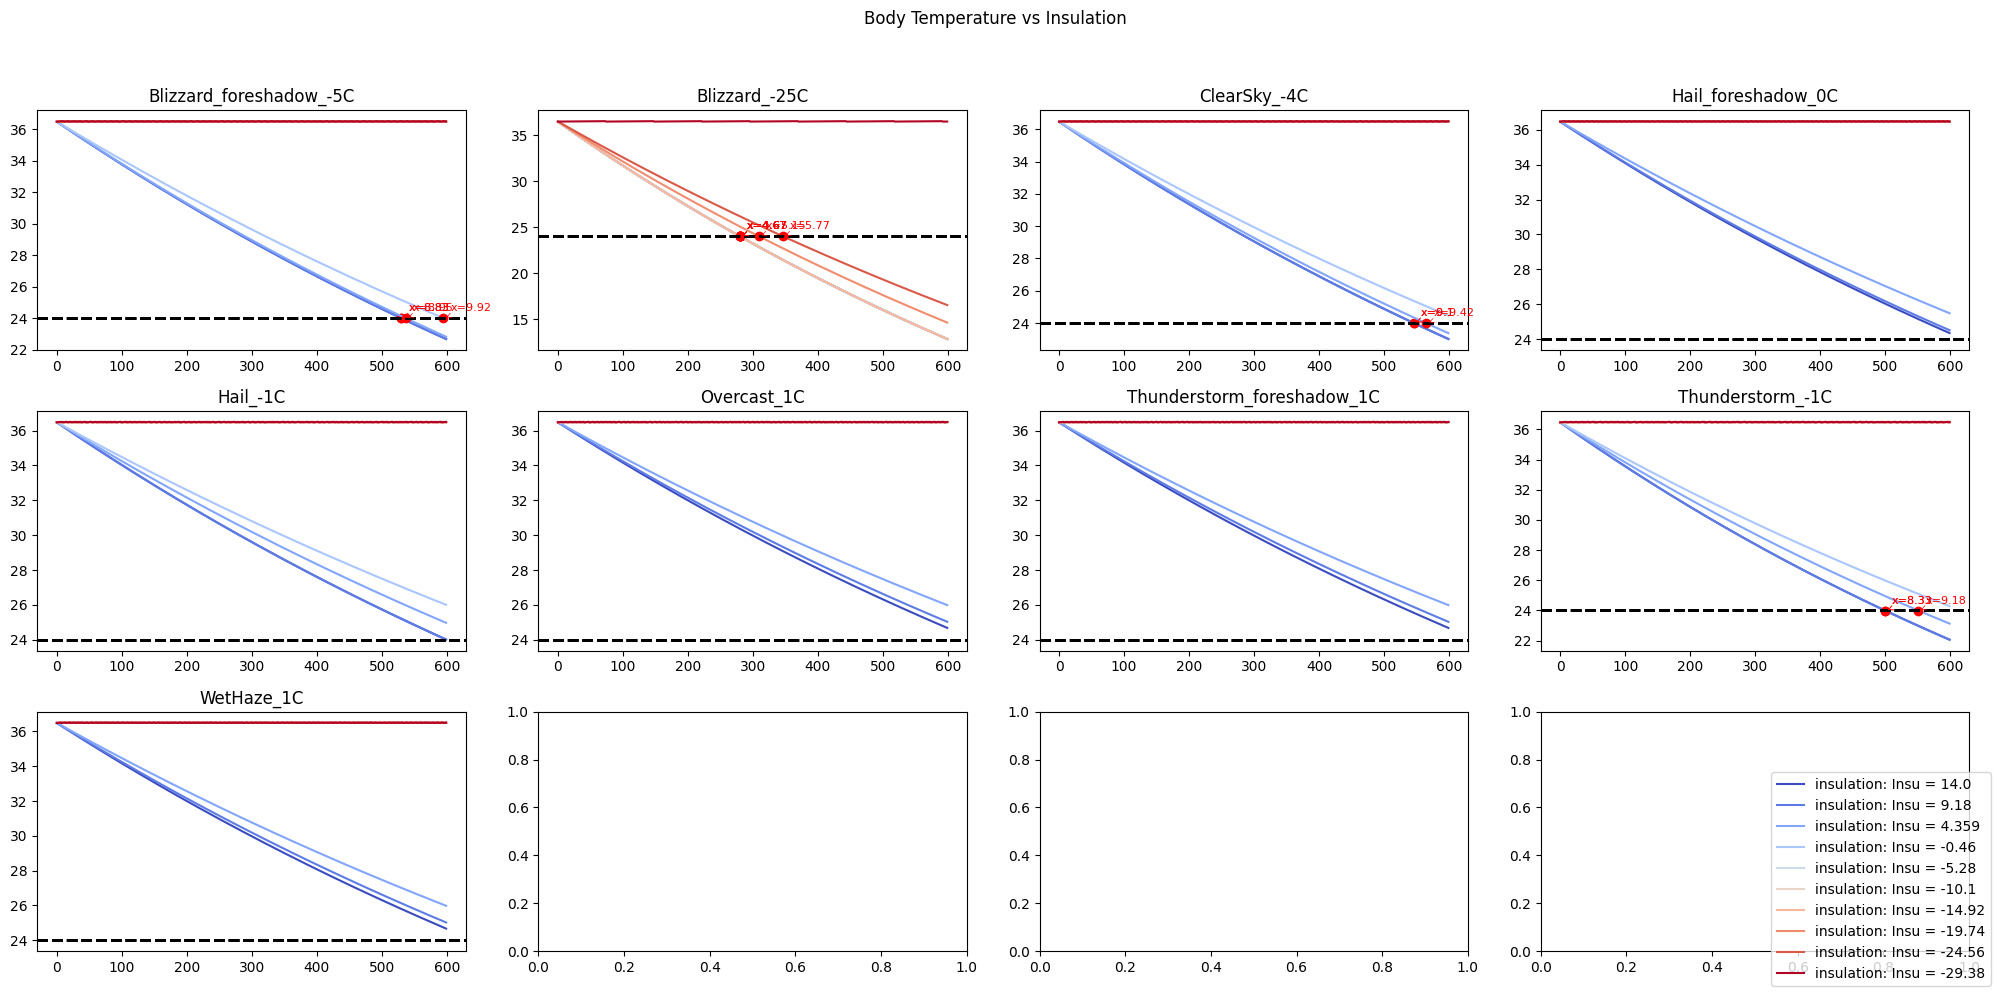
This tool allows us to balance the impact of the weather on the player.
Here you can see that a Blizzard is deadly under 5.77 minutes if you have an insulation above -29 Degrees C.
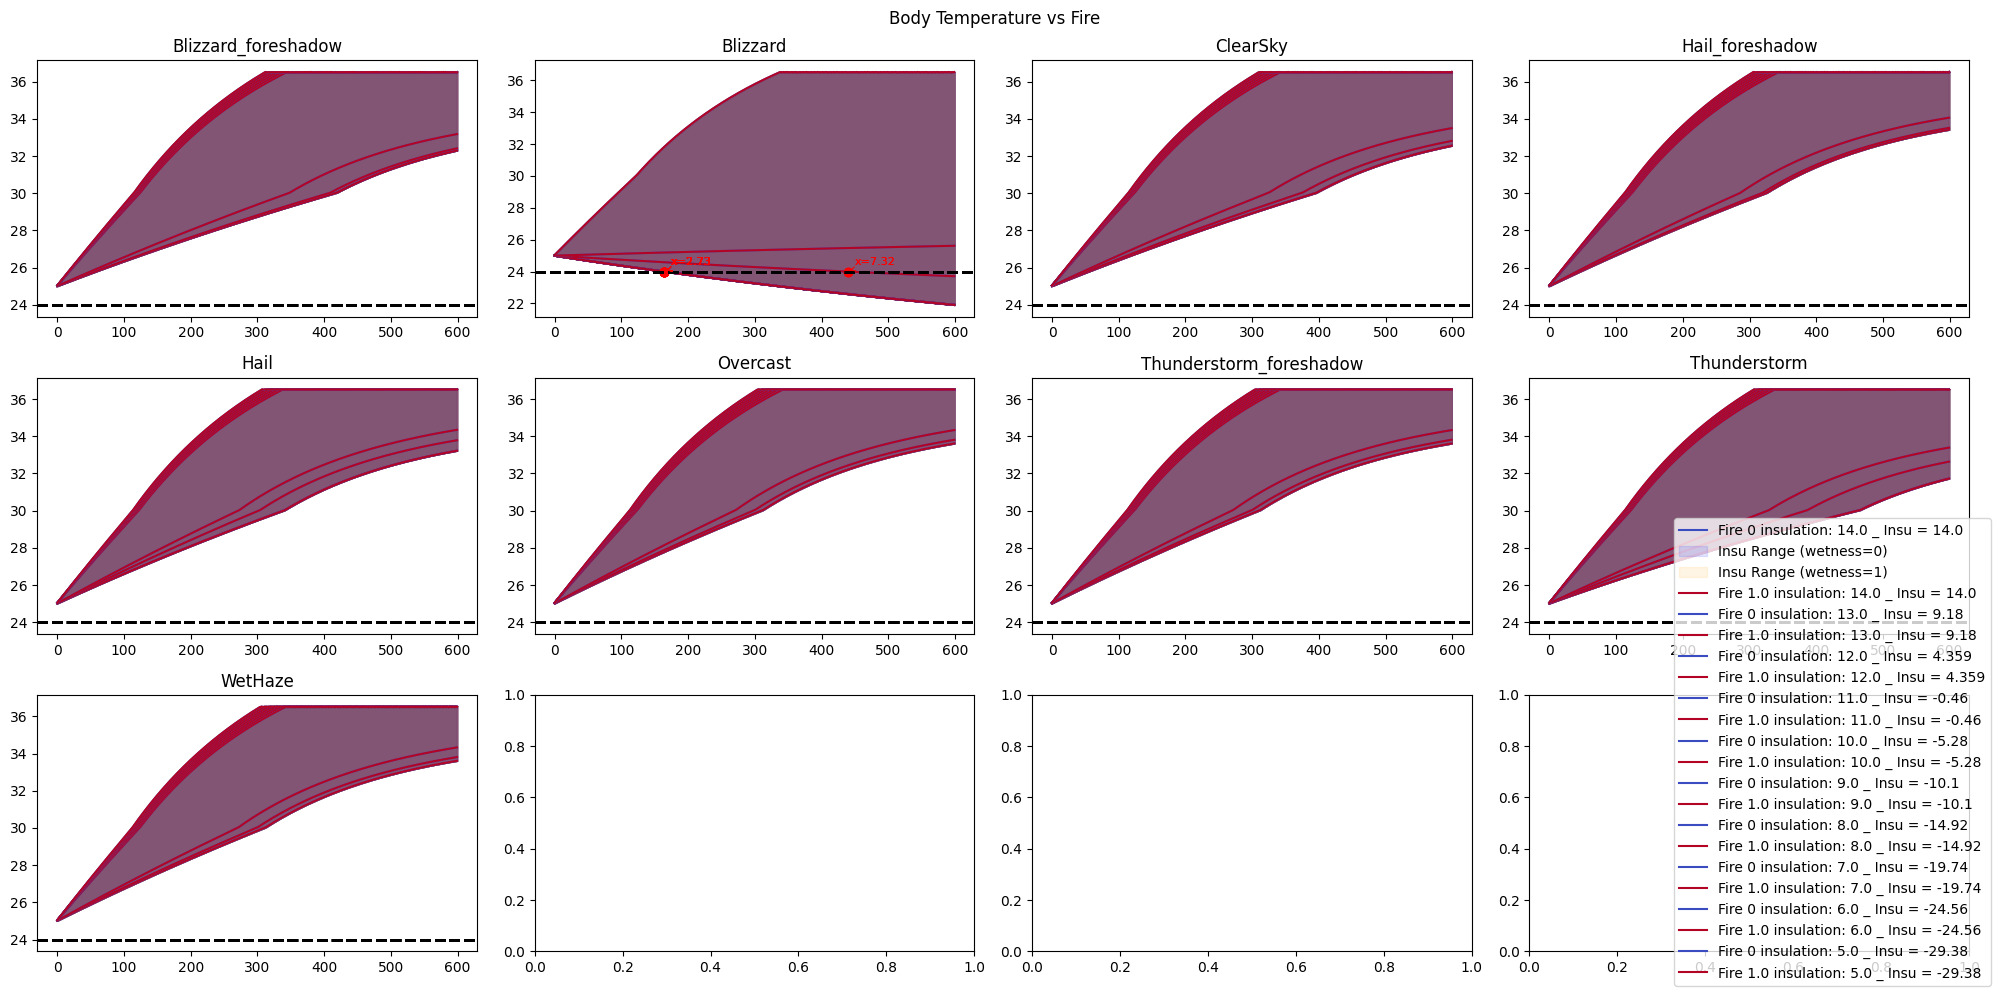
This tool allows us to balance how fast the fire is heating the player.
Here you can see that even a fire might not save players from a blizzard.
The acceleration of the temperature rise indicates the player getting rid of the hypothermia status.
Impact
The tools became part of the balancing workflow and helped guide or cut short many hypothetical design discussions. Instead of debating how a system might behave, we could test a hypothesis in a matter of minutes. If a tool did not already exist, creating one often took only a few hours.
The tools were also useful when investigating analytics. Analytics could tell us that something unusual happened. The tools allowed us to recreate conditions, isolate variables, and determine whether the behavior was expected or the result of an edge case.
For example, if a player died from hypothermia near a fire, the relevant systems could be reproduced inside a predictive tool to verify whether the outcome was legitimate or caused by a bug.
The tools also enabled balancing with specific intentions. Rather than adjusting values blindly, we could ask questions such as “I want players in good condition, wearing the best equipment, to barely survive a blizzard.”
The tools allowed us to test these scenarios directly. Beyond balancing, continuously reproducing and validating the game’s systems made them more robust. Bugs and edge cases were often discovered in the tools before they were encountered in-game.
Some tools didn’t need an update as the system didn’t change much, but the complexity came from another area. Hunger and Hydration balancing were mostly impacted by the resources the player can gather in the game, and for that, another tool was needed [Link to the item balancing tool article].
Takeaways
A deprecated tool does not necessarily become a useless tool. Although the original simulation was retired, its modular architecture made it possible to reuse its components and build a new generation of balancing tools.
One of the biggest lessons was that building modular systems means you are not only building a tool. You are building the foundations that allow future tools to be created quickly and cheaply.
Another important lesson was that the best balancing tool is not always the most accurate one. We rarely need perfect answers; we need answers quickly enough to make informed decisions.
Finally, presenting information visually turned out to be just as important as generating the data itself. Curves, graphs, and immediate feedback removed the barrier of interpretation and allowed discussions to focus on design decisions rather than raw numbers.
Appendix
This section adds details on the examples and images from the article.
Insulation values tool

This is particularly useful for observing patterns. Here we can see a lack of “Yellow” in the jacket column, for insulations os the jacket under -10 degrees. This looks like an anomaly, let’s apply a filter and have a look.
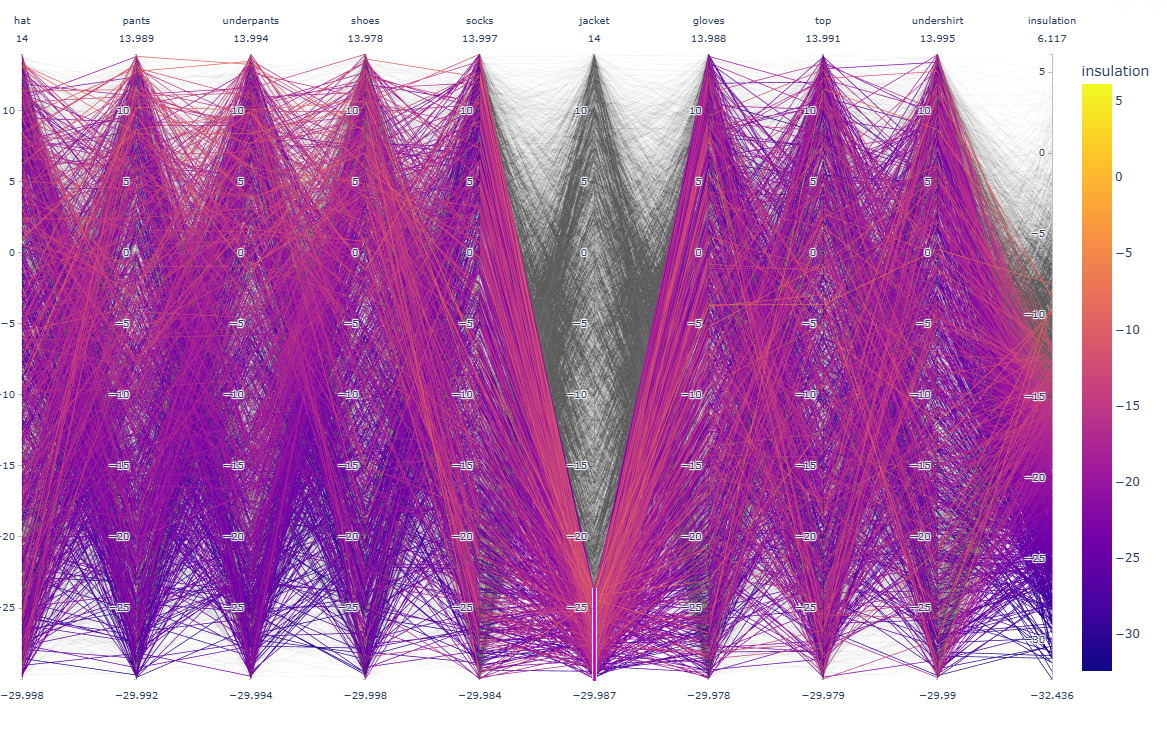
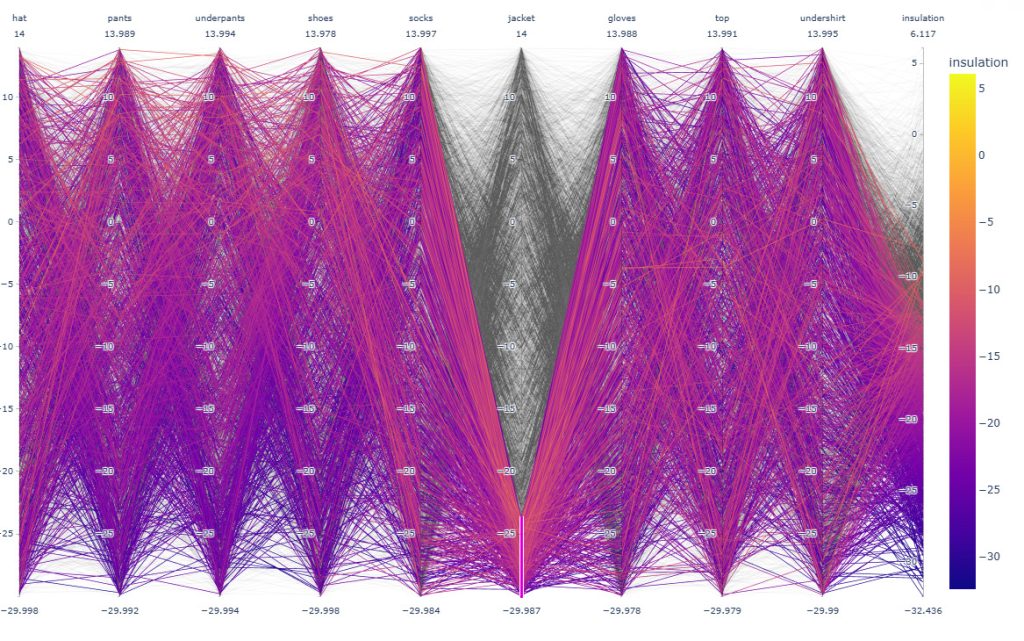
Only iterations that contained a value of insulation for the jacket under -24 have been kept. This filter is similar to the opposite pattern we saw earlier, which confirms that a high insulation on the jacket gives a total insulation of minimum -20 degrees. Let’s investigate more.

The density of the blue lines links the values of the insulation for an item to a high insulation value (under -26 degrees), and therefore, a high density of blue lines on a column (spread on the column) means that this item has a low impact on the total insulation. The opposite is also true: a large density located on specific values, like the jacket. This means that somewhere in the insulation calculation, something gives more weight to the jacket.